Script Tip Friday – Plot Design Point (DP) Results
This Script Tip Friday is brought to you by Christoffer Eriksson, who is an Application Developer at EDRMedeso – Ansys Elite Channel Partner.
Christoffer’s tip will cover how to plot design point (DP) results using PyDPF.

Photo: Christiffer Erilsson, EDRMedeso
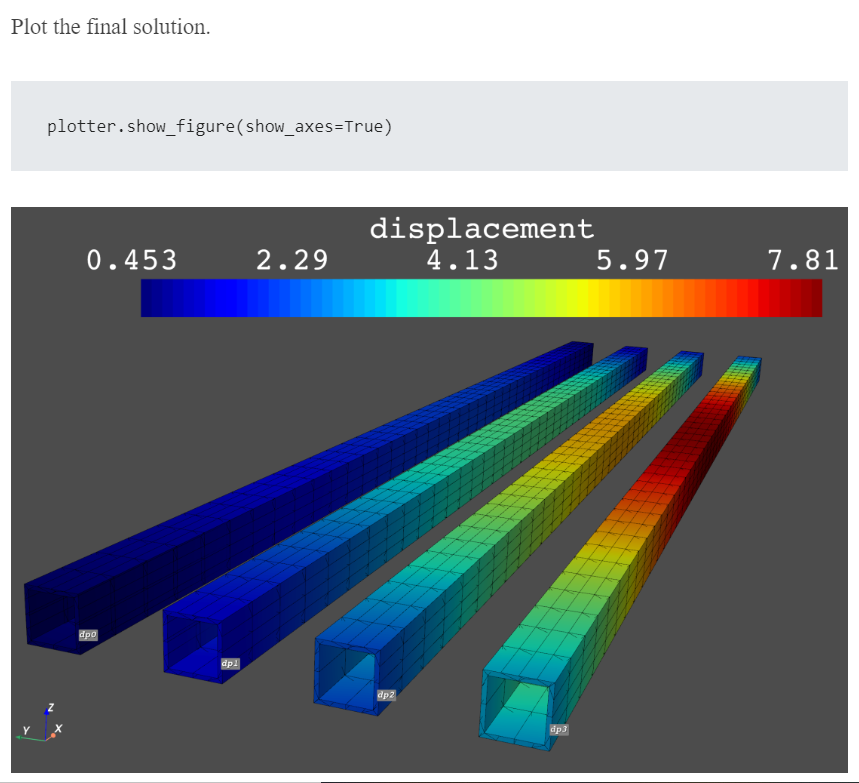
When running parametric simulations, it can often be of value to examine results(s) from each design point to validate the inputs from a graphical point of view (i.e., to get a quick overview). This PyDPF example shows a simple way to plot a deformation result for four design points (DP) in the same window.
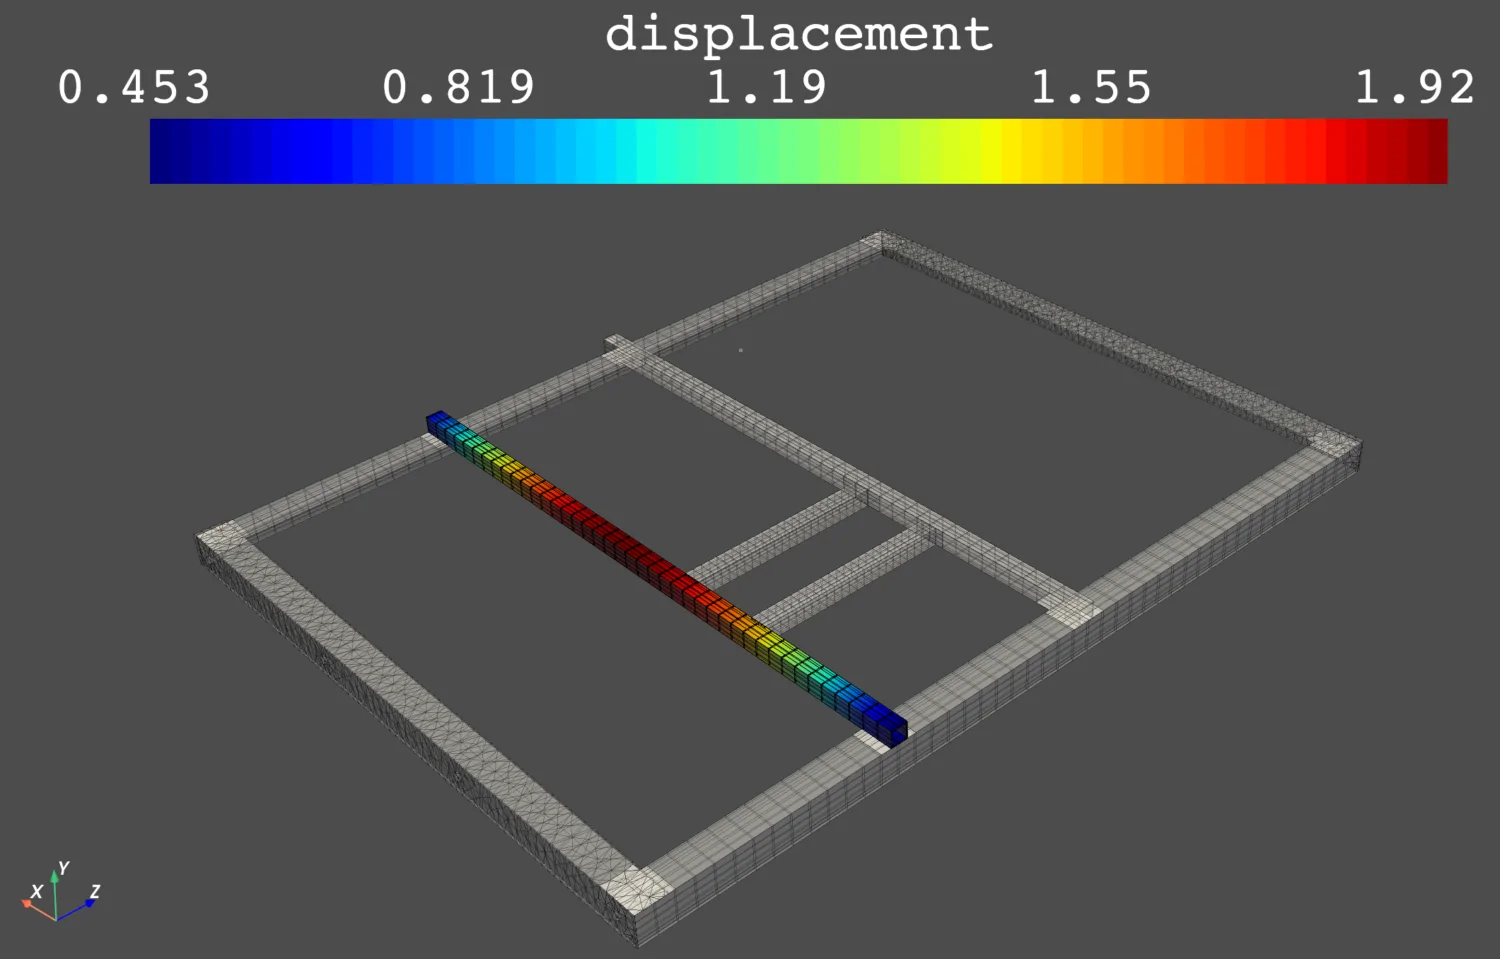
The plot below shows the displacement result on the named selection ‘MYBODY’ for DP0. The aim here is to plot the displacement result on ‘MYBODY’ for all 4 DPs (dp0, dp1, dp2 and dp3) and line up the results next to each other.
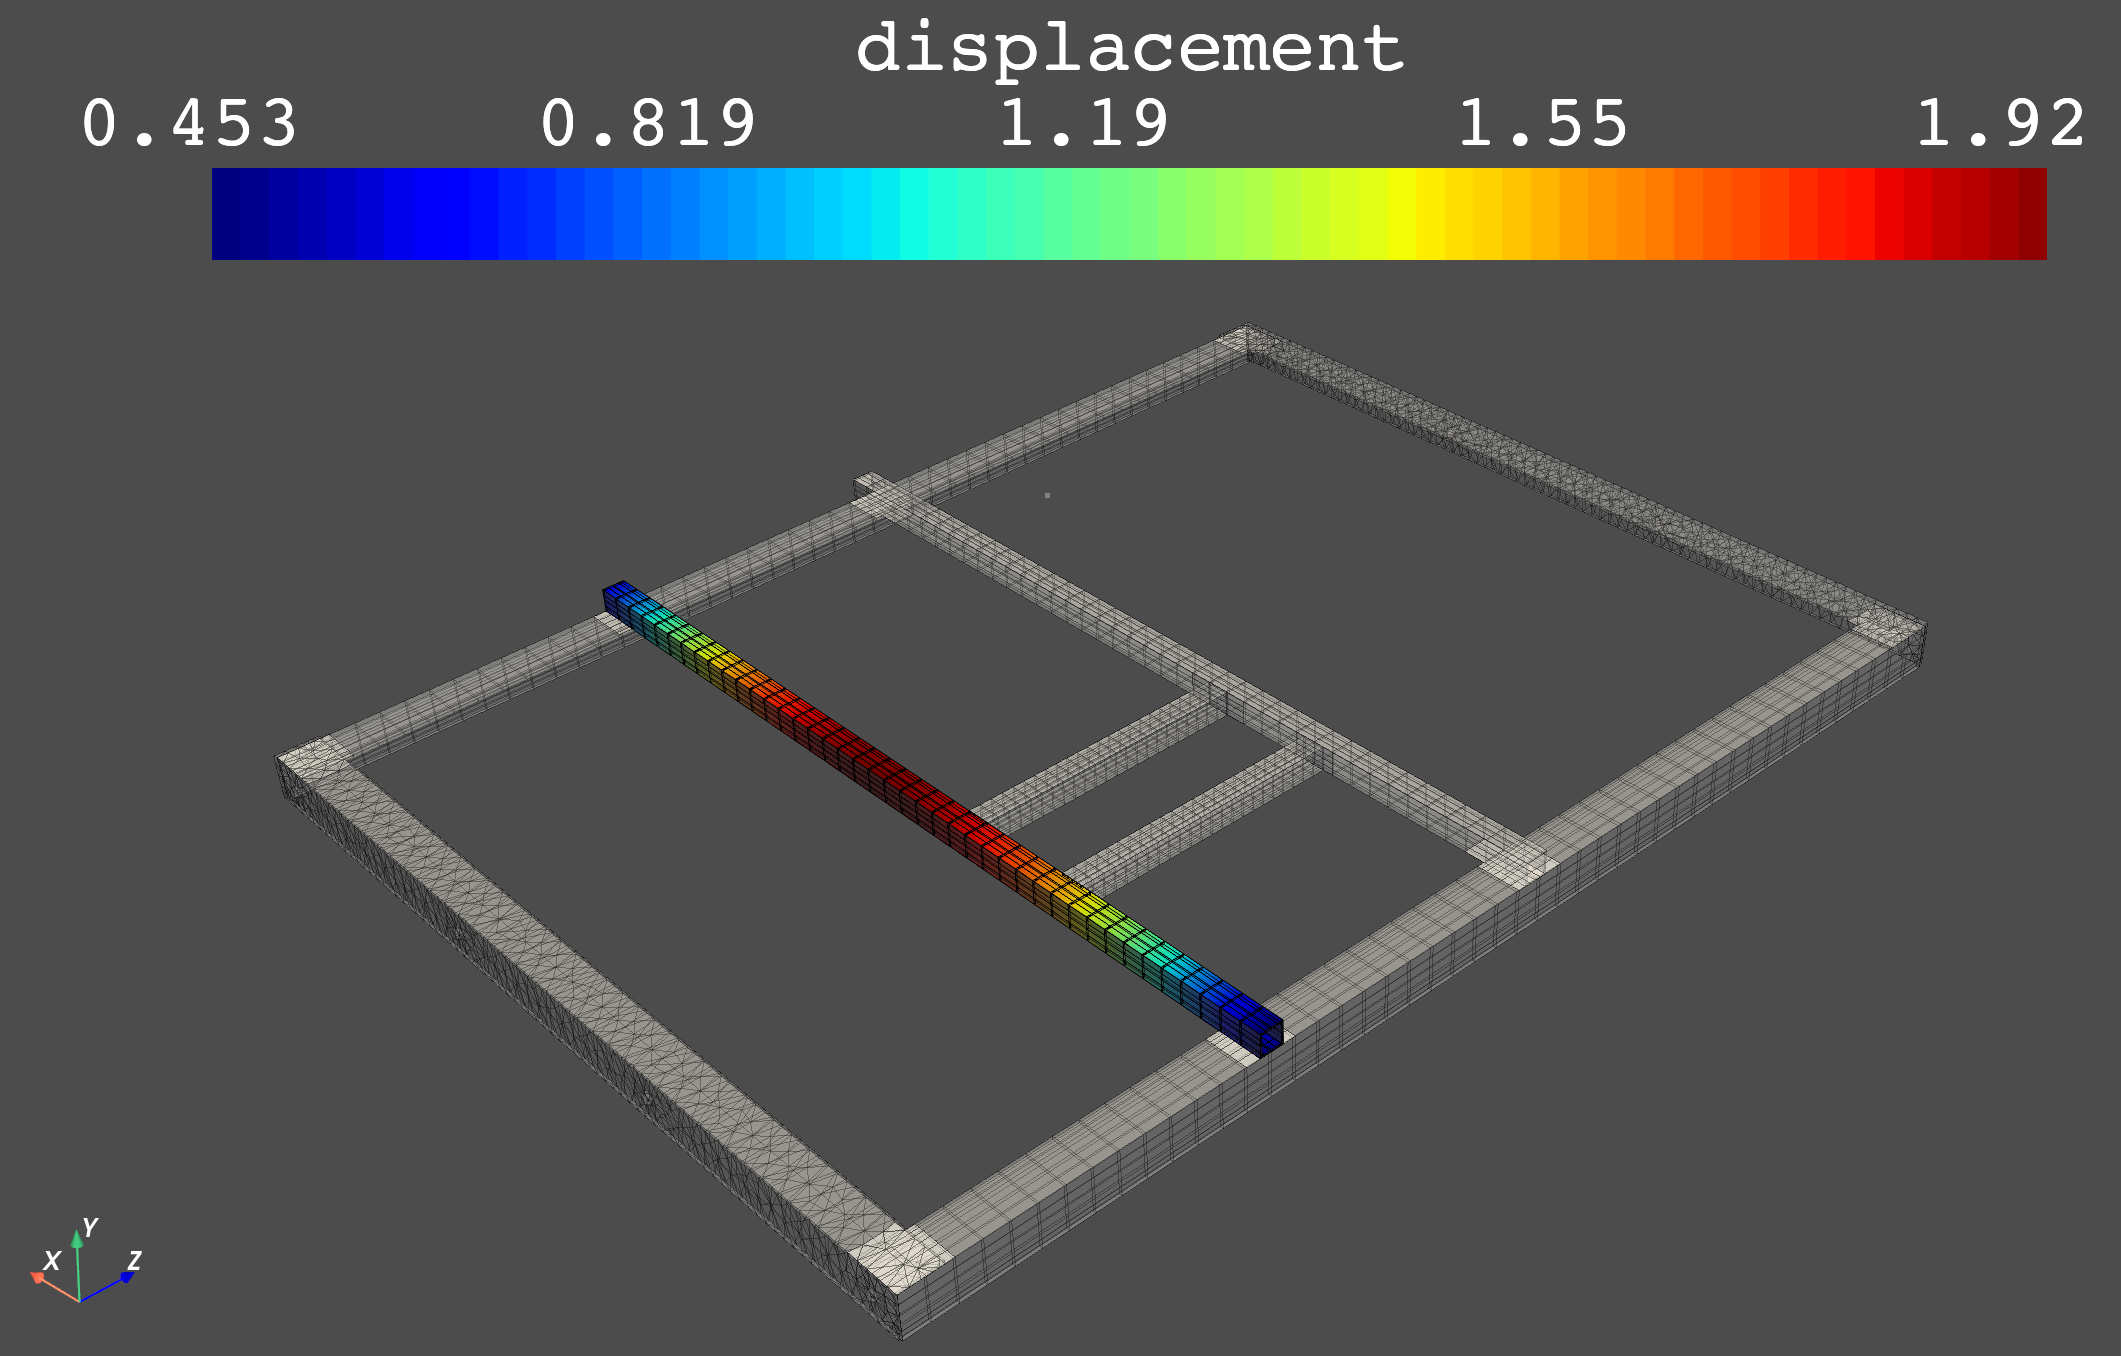
Displacement result for DP0