During the COVID-19 crisis many governments has recommended, or even mandated by law, social distancing. The distance set by many is 1.5 m, but this is when all participants are stationary. How does moving participants affect this distance? Blocken et. al. in the Netherlands decided to have a look at this.
During the COVID-19 crisis many governments has recommended, or even mandated by law, social distancing. The distance set by many is 1.5 m, but this is when all participants are stationary. How does moving participants affect this distance? Blocken et. al. in the Netherlands decided to have a look at this.
Most droplets coughed, sneezed or exhaled by a person will have fallen down before they have travelled 1.5 m, which is what informed the social distance. However, micro-droplets have very little inertia and when to people are walking or running in close proximity to each other the air flow patterns could carry these particles even beyond the 1.5 m.
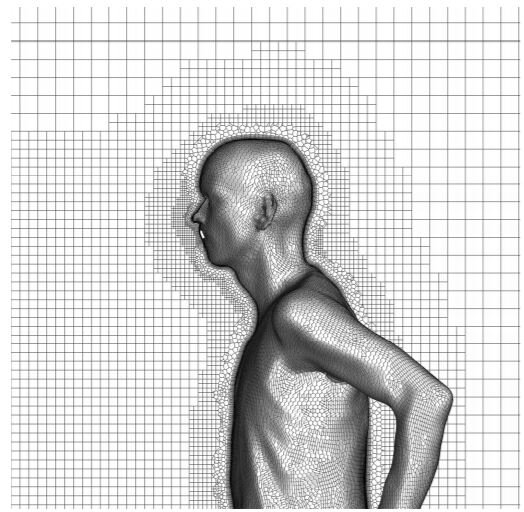
For validation the group performed full scale CFD simulations with the same geometry of a runner that they had used for wind tunnel. They used a rectangular prism fluid domain and a poly-hexa-core mesh. They had a first layer height of 50 µm and 40 inflation layers in the boundary layer. The total cell count was about 6 million cells.
High-resolution computational grid on the runner and in the vertical centerplane.
Total cell count is about 6 millions cells.
At the inlet they specified 4 m/s, or a 4:10 km pace. To match the wind tunnel tests they assumed no head-, tail-, or crosswind. They ran SST turbulence model in Fluent 19.1 with the pseudo transient pressure-velocity coupling.
The validations came out favourably with a computed drag area for the runner of 0.301 m^2 while the measured value was 0.303 m^2.
For the study of the two runners they considered several configurations:
Side-by-side with a distance of 1 m
In line at distances of 1.5 m, 3 m, and beyond in steps of 1.5 m.
Same as above with increasing lateral distance of 1 m steps.
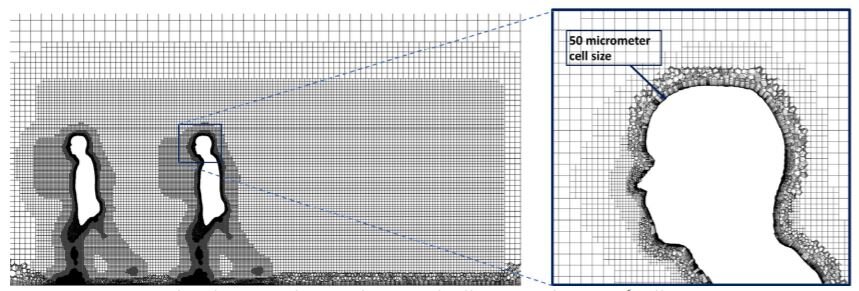
The geometry was the validation runner duplicated and the mesh settings were the same as for the validation case. Total cell count came to about 9 million cells.
Computational grid in vertical centerplane. Total cell count is about 9 millions cells.
The inlet velocity was the same 4 m/s except for the fast walking case where it was set to 1.11 m/s. The breathing velocity for the runners were set to 2.5 m/s, which represent moderately deep breathing. The saliva droplets were represented by water with a Rosin-Rammler droplet distribution and a minimum diameter of 40 µm, an average diameter 80 µm and a maximum diameter of 200 µm.
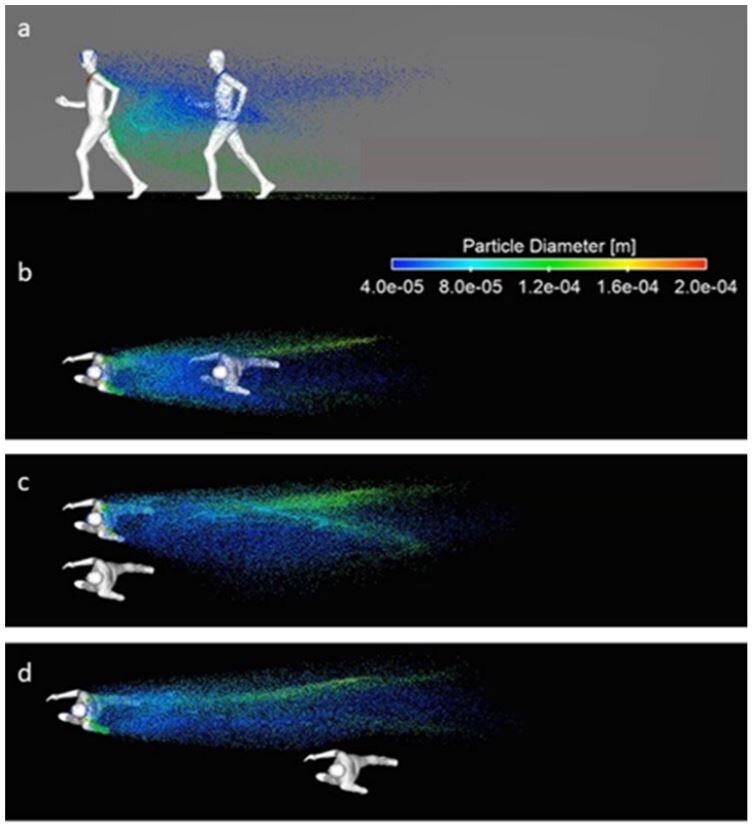
Droplet spreading when running at a speed of 14.4 km/h when (a,b) running behind each other; (c) side-by-side; (d) in staggered arrangement.
The above figure displays particles exhaled from the first runner and shows whether the second runner will end up in them as the lighter particles swirl around in the wake behind the first runner.
For walking speeds, a distance of about 5 m leads to no droplets reaching the torso of the trailing runner. For running the distance is about 10 m.
In conclusion, in order to have the same droplet exposure as two people standing still at 1.5 m, the social distance has to be increased to 5 m and 10 m for walking and running respectively. Any closer than this and any overtaking runner should move out of the slipstream in these windless conditions.
We use cookies to enhance your browsing experience, personalize content and ads, analyze site traffic, and improve our services; by clicking "Accept," you consent to our use of cookies, and you can manage your preferences or learn more about our cookie policy on our Privacy Policy page.
Functional
Always active
These cookies act as personal helpers, enhancing your browsing experience by remembering your preferred language, location, and settings. They're completely anonymous and solely improve your time on our website, ensuring seamless navigation and personalized features like chat services and saved preferences.
Preferences
The technical storage or access is necessary for the legitimate purpose of storing preferences that are not requested by the subscriber or user.
Statistics
The technical storage or access that is used exclusively for statistical purposes.The technical storage or access that is used exclusively for anonymous statistical purposes. Without a subpoena, voluntary compliance on the part of your Internet Service Provider, or additional records from a third party, information stored or retrieved for this purpose alone cannot usually be used to identify you.
Marketing
Marketing cookies are used to track visitors across websites. The intention is to display ads that are relevant and engaging for the individual user and thereby more valuable for publishers and third party advertisers.